
Python can accomplish most day-to-day research tasks and can be used at multiple steps of the research pipeline. Instead of using different software programs to accomplish different tasks, Python can save researchers a significant amount of time and frustration.
FREE
Research organizations use MATLAB and Simulink to apply deep learning, predictive modeling, and statistical analysis techniques. You and your team can share a common set of products for exchanging work and ideas.
PAID
SPSS Statistics is a statistical software suite developed by IBM for data management, advanced analytics, multivariate analysis, business intelligence, and criminal investigation. Long produced by SPSS Inc., it was acquired by IBM in 2009. Current versions (post 2015) have the brand name: IBM SPSS Statistics.
FREE with minimum functionality
A network simulator is a software program that can predict the performance of a computer network or a wireless communication network. Since communication networks have become too complex for traditional analytical methods to provide an accurate understanding of system behavior, network simulators are used.
FREE
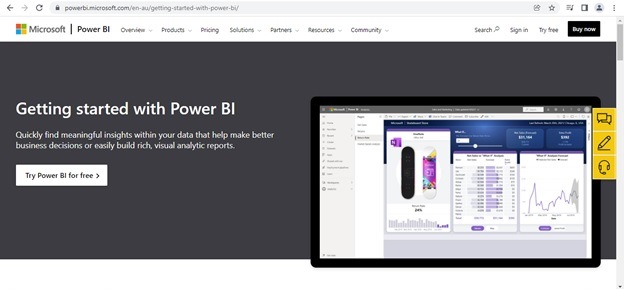
Power BI, from Microsoft, is a suite of business analytics tools that is used to analyze data and share insights in the form of reports and dashboards. User data in various forms – spreadsheets, text files, databases, etc. form the input for Power BI. Datasets are formed by transforming the data provided by the users.
FREE with Minimum Functionality
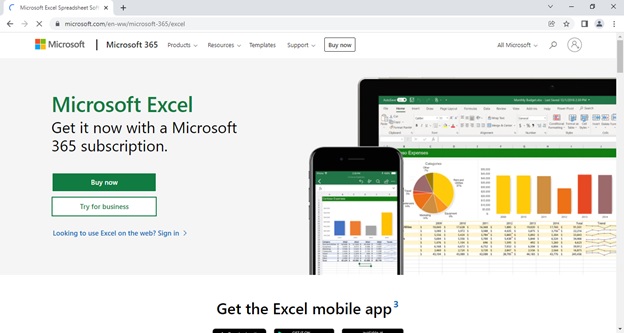
Microsoft Excel is a spreadsheet developed by Microsoft for Windows, macOS, Android and iOS. It features calculation or computation capabilities, graphing tools, pivot tables, and a macro programming language called Visual Basic for Applications (VBA). Excel forms part of the Microsoft Office suite of software.
FREE with Minimum Functionality
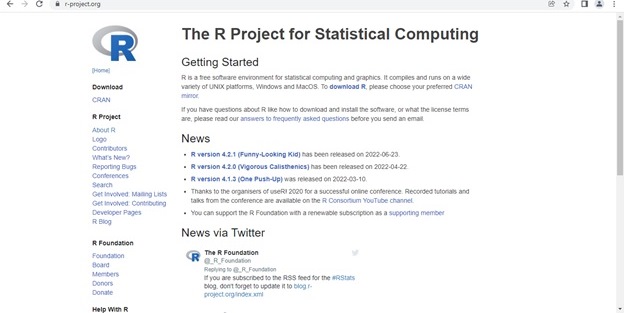
R is a programming language for statistical computing and graphics supported by the R Core Team and the R Foundation for Statistical Computing. Created by statisticians Ross Ihaka and Robert Gentleman, R is used among data miners, bioinformaticians and statisticians for data analysis and developing statistical software.
FREE

Weka contains a collection of visualization tools and algorithms for data analysis and predictive modeling, together with graphical user interfaces for easy access to these functions. The original non-Java version of WEKA was a TCL/TK front-end to modeling algorithms implemented in other programming languages, and a make file-based system for running machine learning experiments.
FREE
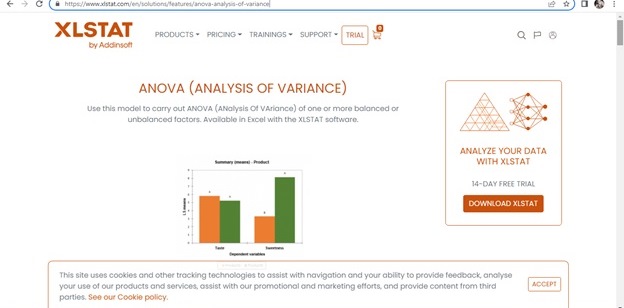
ANOVA is helpful for testing three or more variables. It is similar to multiple two-sample t-tests. However, it results in fewer type I errors and is appropriate for a range of issues. ANOVA groups differences by comparing the means of each group and includes spreading out the variance into diverse sources
FREE with Minimum Functionality